Kilifi County lies between latitude 2020” and 400” south, and between longitude 39005” and 40014” East and covers an area of 12,370.8km2. It has 4 major topographic features which are the narrow belt, the foot plateau, the coastal range and the Nyika Plateau. The county experiences a bimodal rainfall pattern with an average annual precipitation ranging between 300mm and 1300mm. The annual temperatures range between 210C and 300C in the coastal belt and between 300C and 340C in the hinterland. The county is divided into five Agro-Ecological Zones (AEZ). These are; Coconut-Cassava Zone, Cashewnut-Coconut zone, Livestock-Millet Zone, Lowland Ranching and Coconut Cashew Nut – Cassava Zone
Administrative units
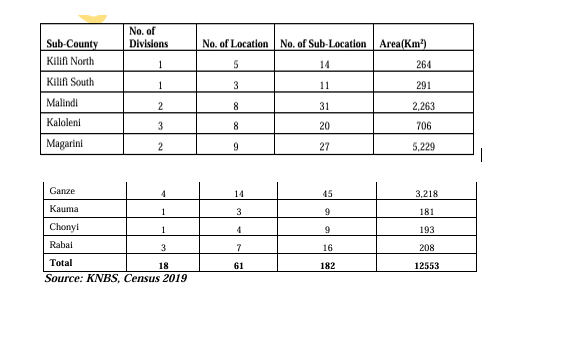
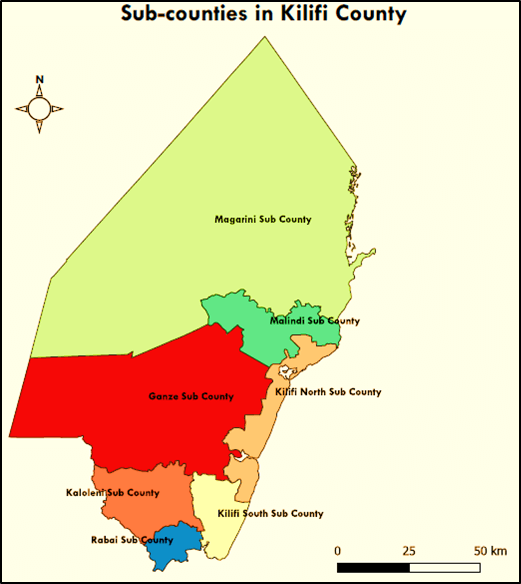
There are seven sub-counties, 35 divisions, 62 locations and 165 sub-locations. All these lies within an area of 12178 km2. Magarini sub-county is the largest with an area of 5229km2 while Rabai is the smallest sub county covering an area of 208km2. There are 35 county government administrative and electoral wards and 1912 villages in the county.


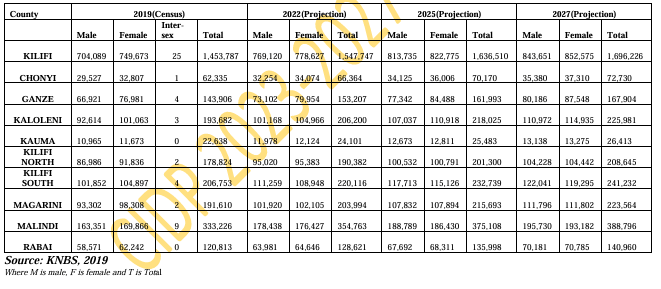
Population
1.2 Position and Size According to the KNBS Census in 2019, Kilifi County had a total population of 1,453,787 made of 704, 089 males and 655,673 females. Naturally, the younger population is higher than the older population. Additionally, out of the 1,453,787, the urban population stood at 338,359 in 2019 with Kilifi South having the most populated urban areas (713 people per square km) while Magarini is the least populated with a population density of 37 people per square km. Currently (2022), the population has been projected to be at 1,517,824 representing a population density of 121 per square km. As per the broad age groups, the labor force has the highest population of 570,262 and the infant population at 37,882 is the lowest. Additionally, there were 20, 044 people with disabilities in the county in 2019.
Population Projections (by Sub-County and Sex)

Population of Persons with Disability by Type, Age and Sex

Health
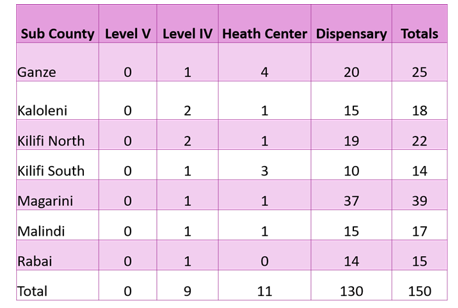
There are a total of 150 MOH-owned health facilities spread across all the 7 sub-counties with one county referral hospital. A360 is being implemented in 115 Facilities as shown in the table below.
Distribution of MOH Facilities

Key Health Indicators
The TFR is at the county is at 3.4% which is equal to the national rate (KDHS 2022).
The use of any contraception among the county’s married women is at a rate of 49% (KDHS 2022) which is way below the National rate of 62.5%. Modern contraceptive use is also at 45%, compared to the National average of 57% (KDHS 2022). The unmet need for contraceptives among married women (15-49 years) is 18%, which is higher than the National rate of 14%.
Teenage pregnancies in the County is at 12.5% (KDHS2022) which is slightly lower than the National rate of 14.9%. This is a great improvement from 24.2% in KDHS 2014.

